
| Immunocyte Phenotyping Panel | Species | Marker |
| Analysis of T / B / NK | Human | CD45 |
| Human | CD3E | |
| Human | CD4 | |
| Human | CD8a | |
| Human | CD19 | |
| Human | CD16 | |
| Human | CD56 | |
| Th1/Th2/Th17 cell | Human | CD3E |
| Human | CD4 | |
| Human | IL-17A | |
| Human | IFN-γ | |
| Human | IL-4 | |
| Analysis of T cell activation status | Human | CD3E |
| Human | CD4 | |
| Human | CD8a | |
| Human | CD25 | |
| Human | CD69 | |
| Native/Memory T cell | Human | CD3E |
| Human | CD4 |
| Immunocyte Phenotyping Panel | Species | Marker |
| Native/Memory T cell | Human | CD45RA |
| Human | CD197 (CCR7) | |
| Analysis of common subpopulations of B cells | Human | CD45 |
| Human | CD19 | |
| Human | CD20 | |
| Human | CD27 | |
| Human | CD38 | |
| Human | IgD | |
| Human | IgM | |
| M1 macrophages | Human | CD3E |
| Human | CD20 | |
| Human | NCAM1/CD56 | |
| Human | CD86 | |
| Human | HLA-DR | |
| M2 macrophages | Human | CD3E |
| Human | CD20 | |
| Human | NCAM1/CD56 | |
| Human | CD163 | |
| Human | MMR/CD206 |
| Panel name | Species | Marker |
| T lymphocyte subsets | Mouse | CD3e |
| Mouse | CD4 | |
| Mouse | CD8a | |
| Th1/Th2/Th17 cell | Mouse | CD3e |
| Mouse | CD4 | |
| Mouse | IFN-γ | |
| Mouse | IL-4 | |
| Mouse | IL-17A | |
| Native/Memory T cell | Mouse | CD3e |
| Mouse | CD4 | |
| Mouse | CD44 |
| Panel name | Species | Marker |
| Native/Memory T cell | Mouse | CD62L |
| T lymphocyte activation | Mouse | CD3e |
| Mouse | CD4 | |
| Mouse | CD8 | |
| Mouse | CD25 | |
| Mouse | CD69 | |
| Macrophage | Mouse | CD45 |
| Mouse | CD11b | |
| Mouse | F4/80 | |
| Mouse | CD86 | |
| Mouse | CD206 |
일반적인 면역세포 표현형(T, B, NK 세포)
Panel Design
| Fluorescent Dyes | 7-AAD-FMO | PE-FMO | ABflo™ 647-FMO | ABflo™ 700-FMO | ABflo™ 488-FMO | Full Panel | Species | Cat.No. | Sample |
| ABflo™ 488 | CD45-ABflo™ 488 | CD45-ABflo™ 488 | CD45-ABflo™ 488 | CD45-ABflo™ 488 | - | CD45-ABflo™ 488 | Human | A22494 | Human PBMC |
| ABflo™ 647 | CD19-ABflo™ 647 | CD19-ABflo™ 647 | - | CD19-ABflo™ 647 | CD19-ABflo™ 647 | CD19-ABflo™ 647 | Human | A23009 | |
| ABflo™ 700 | CD3-ABflo™ 700 | CD3-ABflo™ 700 | CD3-ABflo™ 700 | - | CD3-ABflo™ 700 | CD3-ABflo™ 700 | Human | A24943 | |
| PE | CD56-PE | - | CD56-PE | CD56-PE | CD56-PE | CD56-PE | Human | A22826 | |
| 7-AAD | - | 7-AAD | 7-AAD | 7-AAD | 7-AAD | 7-AAD | Human | - |
Multicolor Manual Gating Analysis
Results: Staining with 7-AAD-FMO, CD56-PE-FMO, CD16-ABflo™ 647, and CD3-ABflo™ 700 showed clear separation between positive and negative cell populations.
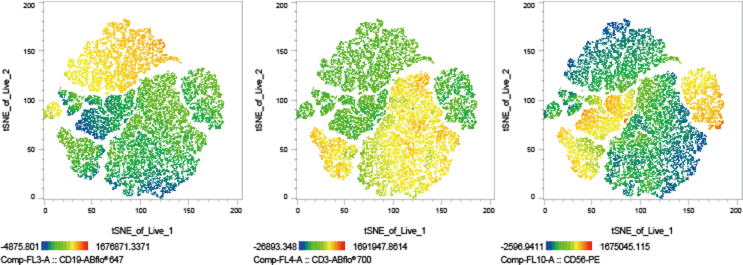
tSNE Dimensionality Reduction Analysis of Signal Distribution for Each Marker

Results: In this plot, colors ranging from red to blue represent the expression level of the corresponding marker. The signal distribution plots for CD3, CD19, and CD56 were consistent with the clustering of T cells, B cells, and NK cells, respectively.
Comparison Analysis of Manual Gating and Automatic tSNE

Results: In this plot, live cell populations gated from lymphocytes are depicted in red, CD19+ B cells (CD45+ CD3- CD19+) in blue, NK cells (CD45+ CD3- CD56+) in orange, and CD3+ CD56- T cells (CD3+ CD56-) in green. CD3+ CD56+ NKT cells are represented by the dark green color. Both manual gating and FlowSOM automated analysis consistently demonstrated clustering and accurate cell counts.
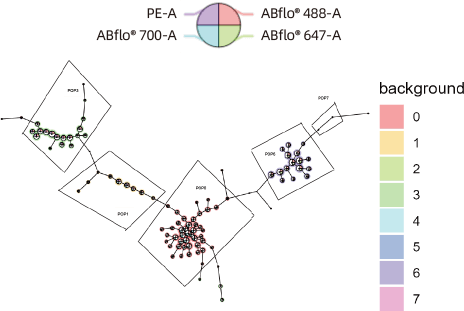
FlowSOM Clustering Analysis
Results: The plot shows the clustering results obtained using FlowSOM's minimum spanning tree visualization. Cells sharing the same background color are assigned to the same cluster, while the size of the bubbles reflects the population size of each cell cluster. The pie charts provide valuable insights into the expression strength of the corresponding marker, with larger areas indicating stronger expression and vice versa.

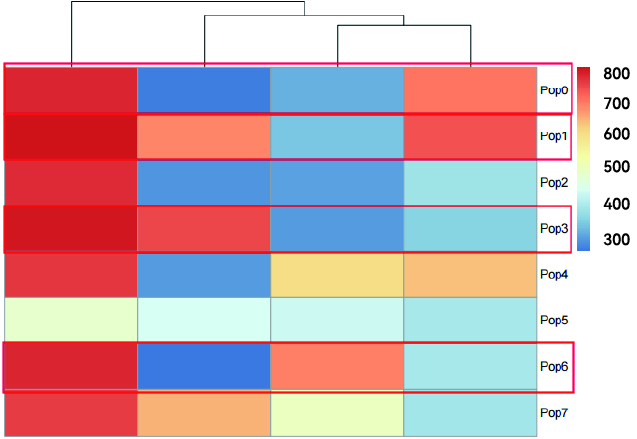
Results: The plot depicts a heatmap generated by FlowSOM, where varying colors from red to blue indicate the expression strength of the corresponding markers. Specifically, POP0 represents the CD3+ CD56- T cell subset (CD45+ CD3+ CD19- CD56-), POP1 represents the CD3+ CD56+ NKT cell subset (CD45+ CD3+ CD19- CD56+), POP3 represents the NK cell subset (CD45+ CD3- CD19- CD56+), and POP6 represents the CD19+ B cell subset (CD45+ CD3- CD19+ CD56-).
